I’m sure you’ve used Crashlytics before, it’s the most used library for crash reporting and it integrates with other Firebase tools. Measuring crashes and other errors is an essential task to make sure your app is working as expected. Nobody likes using apps that crash.
Using a library is cool but have you ever stopped and thought “How does it work under the hood?”, that’s the question I made myself a few days ago and am now going to answer.
This article is part of a new series I’m starting called “How does X work”. I’ll choose libraries and tools that Android Developers use on a daily basis and by reading their documentation and source code, provide an explanation of how the library does what it does.
The library we’ll be looking into today is Firebase Crashlytics. You can find its source code here.

DataCollectionArbiter
If you’ve used Crashlytics before you probably know you can disable it. Maybe you don’t want to collect data for all users or maybe you need to request the user permission for that. This class’s main responsibility is to figure out whether Crashlytics has the permission to collect user data. Most of the library works regardless of this permission, collecting crash report data and storing it on device doesn’t but uploading the crash report to Crashlytics requires it. So if Crashlytics was not enabled and the app crashed but it was enabled after the crash, the crash report will still be uploaded because Crashlytics doesn’t need permission to collect and store things on device.
The DataCollectionArbiter is used exactly for this purpose on CrashlyticsController. If data collection is enabled the reports are uploaded, otherwise it waits for it to be enabled.
CrashlyticsReport
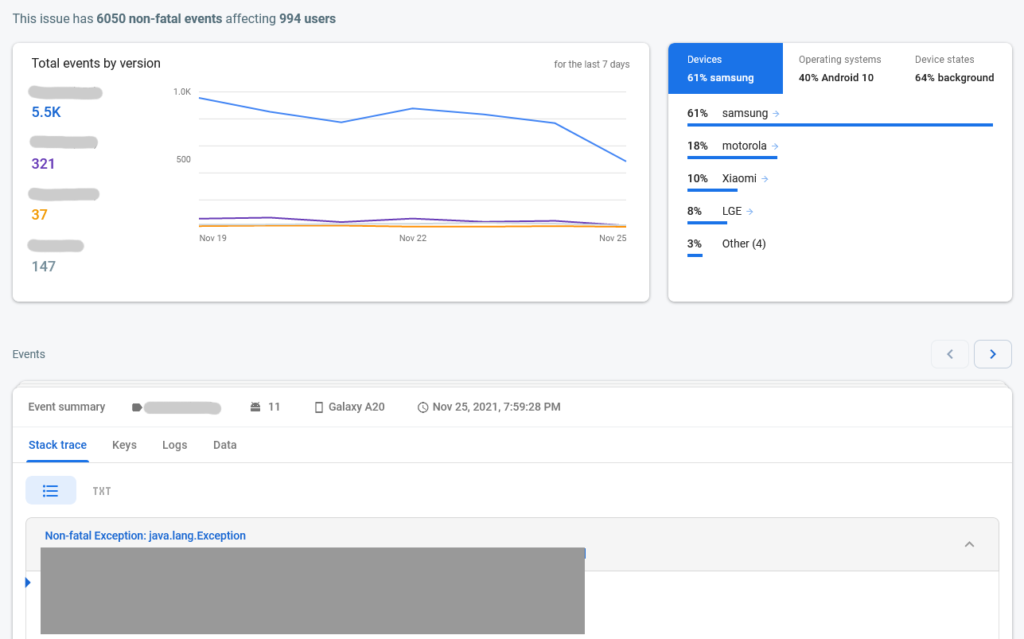
We now arrive at one of the most important classes in Crashlytics. All that you see in the above image comes from 1 class. CrashlyticsReport is the central piece of Crashlytics. It contains information about the device, user, logs, stack traces, etc.
SessionReportingCoordinator
As you can see there’s a lot of information in a CrashlyticsReport, lots of things have to happen for everything to be captured, stored and later uploaded. SessionReportingCoordinator is the class that coordinates all these processes.
One of the first things that happen when Crashlytics is initialized is to open a session. This process includes calling SessionReportingCoordinator.onBeginSession that creates the CrashlyticsReport and stores it. The CrashlyticsReport is created even if your app doesn’t crash that’s why there’s process that later deletes old crash reports.
Besides creating the CrashlyticsReport, it’s also used to store logs and user related information.
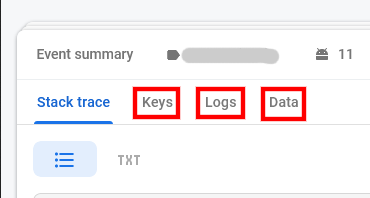
onLog is used to store logs.
onCustomKey is used to store custom information about the user or the app.
onUserId is used to define who the report belongs to.
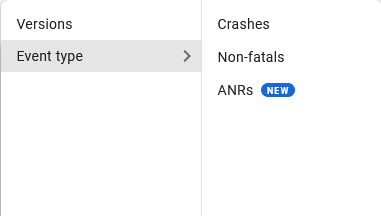
These things are very useful but the main reason Crashlytics is used is for crash reporting. There are 3 types of events and they’re defined as follows:
- Fatal events = crashes
- Non Fatal Events = non-fatals
- AppExitInfo Events = ANRs (Only available on API ≥ 30)
Fatal events happen when the app crashes and Non fatal events happen when you call FirebaseCrashlytics.recordException.
As you can see that’s a lot of work but SessionReportingCoordinator is only responsible for coordinating that. The actual work is done by 3 other classes.
CrashlyticsReportDataCapture [Source]
There’s a lot of information to capture and that’s what this class does. To generate a CrashlyticsReport data from multiple places have to be joined together. Getting the device version, API level, RAM usage, free disk space, screen rotation, battery level, etc.
CrashlyticsReportPersistence [Source]
Responsible for storing reports on a persistent media. It’s two main methods are persistReport and persistEvent.
DataTransportCrashlyticsReportSender [Source]
Now that data is being captured and stored, something has to upload it. It has one main method sendReport that sends the CrashlyticsReport to Firebase.
One interesting thing they did was to separate their endpoint and API key into 2 strings and later merge them by calling mergeStrings. I don’t know exactly why they did that but I think it’s just not to have the data in clear text.
CrashlyticsController [Source]
We saw many classes but almost none of them do anything by themselves. They’re always told what to do by somebody else. CrashlyticsController is a different. It’s the class that tells other what to do.
Everything starts when enableExceptionHandling is called by CrashlyticsCore.
- First a session is opened. This is when
SessionReportingCoordinator.onBeginSessionis called and the initialCrashlyticsReportis created. - Second the uncaught exception handler is set. In case you don’t know all threads have a default exception handler that sends the exception to the JVM thereby crashing the app. Crashlytics creates a exception handler that intercepts the exceptions that weren’t caught and does something with them but it also sends the exception to the previous exception handler, that’s why the app stills crashes.
That’s it, Crashlytics is initialized. Unless something happens that’s where the library finishes its work. Now let’s see the most important part, what happens when an uncaught exception happens.
The exception handler that was set up earlier will call handleUncaughtException when the exception occurs. Here’s a simplified overview of what happens:
crashMarker.createis called to create a marker that indicates a crash happened.reportingCoordinator.persistFatalEventis called to persist the exception.doCloseSessionsis called and the current session is closed.doOpenSessionis called and a new session is opened.logAnalyticsAppExceptionEventsandreportingCoordinator.sendReportsare called if data collection is enabled. This causes all data that was collected to be uploaded to Crashlytics.
The above code returns a Task that only completes when all the steps are executed. That’s needed because the app can’t crash while data is being uploaded, to avoid that, Crashlytics blocks the main thread until the task completes.

CrashlyticsCore
Responsible for initializing the library. The SessionReportingCoordinator, StackTraceTrimmingStrategy and CrashlyticsController are all created here.
FirebaseCrashlytics is the main API provided by Crashlytics and is basically a wrapper around CrashlyticsCore. Its main functionality is to provide a stable and clean interface so code doesn’t get coupled to implementation details of CrashlyticsCore. CrashlyticsCore also doesn’t do much, most of its calls are delegated to CrashlyticsController.
CrashlyticsFileMarker
RAM is not always enough, its contents are lost when the app exits. Sometimes you need to record some information and recover it the next time the app starts. There are many ways you can do that in Android and Crashlytics does it in a particular way. CrashlyticsFileMarker is not like a database where you can store information, it simply creates a file as a marker. It’s three main methods are create, isPresent and remove.
The two main uses are in CrashlyticsCore.
- The first use indicates if the initialization is in progress. The marker is created when the initialization starts and deleted when it finishes so if the marker is present when the app starts it’s because the previous initialization failed.
- The second use is to indicate if the app crashed.
StackTraceTrimmingStrategy
You probably heard of the strategy pattern but have you ever used it? I’ve used it only once before and the example provided by Crashlytics fits its definition very well.
The Strategy pattern suggests that you take a class that does something specific in a lot of different ways and extract all of these algorithms into separate classes called strategies.
Refactoring Guru
The main reason exceptions are expensive to throw is that they collect the stack trace of their thread and that takes some time. The stack trace is extremely useful for debugging and if you’ve used the Crashlytics Dashboard before you know that’s one of the main information shown. But it doesn’t simply show one stack trace, it collects stack traces from multiple threads.
What’s the problem here then? Well, you may have hundreds of threads running and that would be a lot of information to upload so they had to create something that would trim stack traces but there’s many ways you can do that, you can remove the oldest ones, you can remote the middle ones, you can remote the repeated ones, etc. There are many ways to trim a list of stack traces.
You see? That’s exactly what the strategy pattern is for. You want do to something but there are many ways to do it. Crashlytics defines 3 strategies:
RemoveRepeatsStrategy: Removes stack traces if they repeated times more than the desired value.MiddleOutStrategy: Removes stack traces from the middle of the list if it’s over the desired length.MiddleOutFallbackStrategy: Runs one or more strategies to reduce the stack trace length and if the desired length was still not achived, theMiddleOutStrategyis used.
Crashlytics basically uses these 3. Here’s the code of the strategy that’s used to decide what stack traces are kept and which are trimmed.
First it’ll use RemoveRepeatsStrategy to remove stack traces that have happened more than 10x and then use MiddleOutStrategy to keep at most 1024 stack traces.
CommonUtils
I also found 2 pieces of code on CommonUtils that might be useful.
The first one is used to verify if the device is an emulator. It may not fit all use cases but it’s good enough for Crashlytics.
There’s also this code that’s used to verify whether the device is rooted.
All the analysis was done by me so if you know something that might be wrong please leave a comment or reach me out on Twitter.
I really enjoyed exploring Crashlytics to learn how it works and I hope you too. Please leave suggestions of other libraries you’d be interested in.
Thank you for reading.
Cover photo by Rita Morais on Unsplash